House Price South Africa tracks house prices in South Africa since January 1966. House Price South Africa uses ABSA house prices, as defined at the bottom of this page.
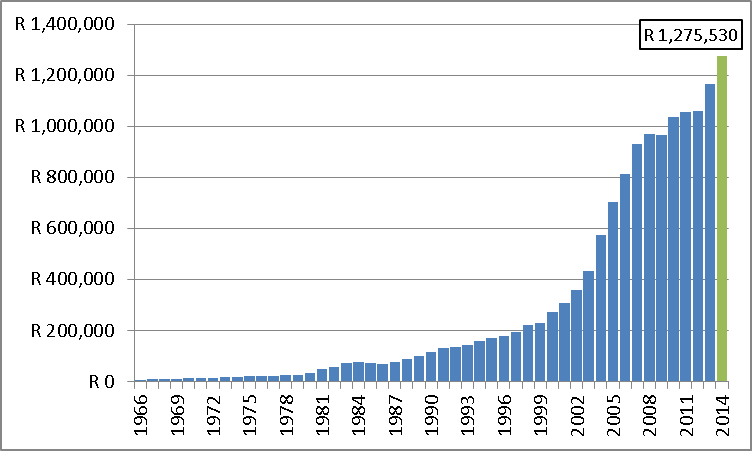
Average “nominal” house prices in South Africa – 1966 to 2014
Quick links
Nominal house prices (annual) since 1966
Nominal house prices (monthly) since 1966
Nominal house prices (annual) predicted to 2050
Average nominal house prices in South Africa – 2014 to 1966
Year	Price	        Growth
2014	R 1,275,530	9.31%
2013	R 1,166,840	9.95%
2012	R 1,061,226	0.64%
2011	R 1,054,448	1.74%
2010	R 1,036,428	7.42%
2009	R 964,835	-0.36%
2008	R 968,303	4.11%
2007	R 930,116	14.54%
2006	R 812,028	15.31%
2005	R 704,205	22.71%
2004	R 573,869	32.24%
2003	R 433,969	21.18%
2002	R 358,132	15.27%
2001	R 310,685	14.28%
2000	R 271,863	17.12%
1999	R 232,127	4.90%
1998	R 221,284	13.81%
1997	R 194,435	8.94%
1996	R 178,486	3.60%
1995	R 172,276	7.60%
1994	R 160,113	10.68%
1993	R 144,659	4.96%
1992	R 137,825	4.39%
1991	R 132,032	13.39%
1990	R 116,443	14.76%
1989	R 101,468	14.65%
1988	R 88,503	15.10%
1987	R 76,895	9.73%
1986	R 70,078	-3.97%
1985	R 72,973	-7.69%
1984	R 79,048	9.02%
1983	R 72,506	20.28%
1982	R 60,283	20.22%
1981	R 50,143	38.30%
1980	R 36,258	23.83%
1979	R 29,281	11.98%
1978	R 26,147	4.34%
1977	R 25,060	1.89%
1976	R 24,596	6.05%
1975	R 23,193	9.08%
1974	R 21,261	8.27%
1973	R 19,638	15.29%
1972	R 17,034	5.51%
1971	R 16,144	7.02%
1970	R 15,085	14.52%
1969	R 13,172	11.56%
1968	R 11,808	4.51%
1967	R 11,298	18.72%
1966	R 9,516
Monthly average nominal house prices in South Africa – current to Jan 1966
Month	        Price	        Growth (month on month)
31-May-2015	R 1,334,848	0.12%
30-Apr-2015	R 1,333,268	0.16%
31-Mar-2015	R 1,331,171	0.14%
28-Feb-2015	R 1,329,244	0.22%
31-Jan-2015	R 1,326,377	0.29%
31-Dec-2014	R 1,322,515	0.40%
30-Nov-2014	R 1,317,291	0.57%
31-Oct-2014	R 1,309,858	0.72%
30-Sep-2014	R 1,300,488	0.75%
31-Aug-2014	R 1,290,760	0.70%
31-Jul-2014	R 1,281,843	0.69%
30-Jun-2014	R 1,273,121	0.78%
31-May-2014	R 1,263,324	0.83%
30-Apr-2014	R 1,252,901	0.83%
31-Mar-2014	R 1,242,617	0.80%
28-Feb-2014	R 1,232,708	0.79%
31-Jan-2014	R 1,222,998	0.84%
31-Dec-2013	R 1,212,797	0.89%
30-Nov-2013	R 1,202,097	0.84%
31-Oct-2013	R 1,192,120	0.79%
30-Sep-2013	R 1,182,778	0.76%
31-Aug-2013	R 1,173,864	0.65%
31-Jul-2013	R 1,166,316	0.48%
30-Jun-2013	R 1,160,748	0.44%
31-May-2013	R 1,155,632	0.50%
30-Apr-2013	R 1,149,881	0.60%
31-Mar-2013	R 1,143,040	0.71%
28-Feb-2013	R 1,134,976	0.84%
31-Jan-2013	R 1,125,511	0.90%
31-Dec-2012	R 1,115,417	0.93%
30-Nov-2012	R 1,105,134	0.93%
31-Oct-2012	R 1,094,926	0.91%
30-Sep-2012	R 1,085,018	0.97%
31-Aug-2012	R 1,074,579	1.12%
31-Jul-2012	R 1,062,661	1.22%
30-Jun-2012	R 1,049,842	1.13%
31-May-2012	R 1,038,143	0.87%
30-Apr-2012	R 1,029,147	0.50%
31-Mar-2012	R 1,024,036	-0.02%
29-Feb-2012	R 1,024,242	-0.50%
31-Jan-2012	R 1,029,439	-0.85%
31-Dec-2011	R 1,038,283	-1.00%
30-Nov-2011	R 1,048,780	-0.89%
31-Oct-2011	R 1,058,181	-0.63%
30-Sep-2011	R 1,064,903	-0.33%
31-Aug-2011	R 1,068,392	-0.01%
31-Jul-2011	R 1,068,494	0.30%
30-Jun-2011	R 1,065,322	0.49%
31-May-2011	R 1,060,179	0.61%
30-Apr-2011	R 1,053,725	0.59%
31-Mar-2011	R 1,047,547	0.53%
28-Feb-2011	R 1,042,065	0.45%
31-Jan-2011	R 1,037,360	0.46%
31-Dec-2010	R 1,032,579	0.54%
30-Nov-2010	R 1,026,994	0.50%
31-Oct-2010	R 1,021,880	0.23%
30-Sep-2010	R 1,019,508	-0.24%
31-Aug-2010	R 1,021,953	-0.81%
31-Jul-2010	R 1,030,301	-1.15%
30-Jun-2010	R 1,042,331	-1.04%
31-May-2010	R 1,053,271	-0.50%
30-Apr-2010	R 1,058,579	0.30%
31-Mar-2010	R 1,055,452	1.07%
28-Feb-2010	R 1,044,278	1.42%
31-Jan-2010	R 1,029,679	1.36%
31-Dec-2009	R 1,015,883	1.08%
30-Nov-2009	R 1,005,077	0.89%
31-Oct-2009	R 996,194	1.05%
30-Sep-2009	R 985,796	1.37%
31-Aug-2009	R 972,469	1.64%
31-Jul-2009	R 956,821	1.55%
30-Jun-2009	R 942,239	0.94%
31-May-2009	R 933,467	0.11%
30-Apr-2009	R 932,464	-0.54%
31-Mar-2009	R 937,563	-0.90%
28-Feb-2009	R 946,122	-0.82%
31-Jan-2009	R 953,945	-0.50%
31-Dec-2008	R 958,751	-0.26%
30-Nov-2008	R 961,286	-0.20%
31-Oct-2008	R 963,254	-0.27%
30-Sep-2008	R 965,815	-0.33%
31-Aug-2008	R 969,042	-0.34%
31-Jul-2008	R 972,380	-0.28%
30-Jun-2008	R 975,088	-0.03%
31-May-2008	R 975,418	0.18%
30-Apr-2008	R 973,696	0.25%
31-Mar-2008	R 971,288	0.30%
29-Feb-2008	R 968,358	0.33%
31-Jan-2008	R 965,155	0.30%
31-Dec-2007	R 962,292	0.35%
30-Nov-2007	R 958,981	0.42%
31-Oct-2007	R 954,963	0.43%
30-Sep-2007	R 950,918	0.47%
31-Aug-2007	R 946,502	0.64%
31-Jul-2007	R 940,517	0.83%
30-Jun-2007	R 932,816	0.95%
31-May-2007	R 924,006	1.07%
30-Apr-2007	R 914,262	1.18%
31-Mar-2007	R 903,591	1.27%
28-Feb-2007	R 892,250	1.36%
31-Jan-2007	R 880,277	1.47%
31-Dec-2006	R 867,482	1.51%
30-Nov-2006	R 854,595	1.45%
31-Oct-2006	R 842,408	1.30%
30-Sep-2006	R 831,569	1.12%
31-Aug-2006	R 822,361	0.96%
31-Jul-2006	R 814,569	0.92%
30-Jun-2006	R 807,168	1.02%
31-May-2006	R 799,036	1.13%
30-Apr-2006	R 790,092	1.20%
31-Mar-2006	R 780,736	1.19%
28-Feb-2006	R 771,559	1.15%
31-Jan-2006	R 762,751	1.13%
31-Dec-2005	R 754,193	1.16%
30-Nov-2005	R 745,521	1.22%
31-Oct-2005	R 736,568	1.26%
30-Sep-2005	R 727,394	1.30%
31-Aug-2005	R 718,058	1.30%
31-Jul-2005	R 708,811	1.33%
30-Jun-2005	R 699,526	1.35%
31-May-2005	R 690,214	1.35%
30-Apr-2005	R 681,011	1.35%
31-Mar-2005	R 671,915	1.33%
28-Feb-2005	R 663,076	1.36%
31-Jan-2005	R 654,165	1.44%
31-Dec-2004	R 644,907	1.59%
30-Nov-2004	R 634,817	1.83%
31-Oct-2004	R 623,389	2.12%
30-Sep-2004	R 610,442	2.36%
31-Aug-2004	R 596,374	2.50%
31-Jul-2004	R 581,850	2.56%
30-Jun-2004	R 567,325	2.56%
31-May-2004	R 553,173	2.56%
30-Apr-2004	R 539,366	2.61%
31-Mar-2004	R 525,621	2.74%
29-Feb-2004	R 511,624	2.83%
31-Jan-2004	R 497,543	2.87%
31-Dec-2003	R 483,652	2.77%
30-Nov-2003	R 470,631	2.45%
31-Oct-2003	R 459,356	2.08%
30-Sep-2003	R 449,994	1.75%
31-Aug-2003	R 442,268	1.57%
31-Jul-2003	R 435,439	1.53%
30-Jun-2003	R 428,895	1.60%
31-May-2003	R 422,147	1.75%
30-Apr-2003	R 414,900	1.86%
31-Mar-2003	R 407,343	1.86%
28-Feb-2003	R 399,891	1.73%
31-Jan-2003	R 393,107	1.55%
31-Dec-2002	R 387,092	1.39%
30-Nov-2002	R 381,784	1.35%
31-Oct-2002	R 376,691	1.40%
30-Sep-2002	R 371,497	1.52%
31-Aug-2002	R 365,943	1.66%
31-Jul-2002	R 359,979	1.69%
30-Jun-2002	R 353,984	1.66%
31-May-2002	R 348,216	1.44%
30-Apr-2002	R 343,278	1.14%
31-Mar-2002	R 339,395	0.92%
28-Feb-2002	R 336,309	0.87%
31-Jan-2002	R 333,418	0.87%
31-Dec-2001	R 330,538	0.95%
30-Nov-2001	R 327,424	1.12%
31-Oct-2001	R 323,786	1.22%
30-Sep-2001	R 319,875	1.32%
31-Aug-2001	R 315,709	1.33%
31-Jul-2001	R 311,564	1.32%
30-Jun-2001	R 307,508	1.21%
31-May-2001	R 303,833	1.06%
30-Apr-2001	R 300,649	0.90%
31-Mar-2001	R 297,962	0.75%
28-Feb-2001	R 295,731	0.71%
31-Jan-2001	R 293,643	0.85%
31-Dec-2000	R 291,182	1.08%
30-Nov-2000	R 288,068	1.30%
31-Oct-2000	R 284,384	1.49%
30-Sep-2000	R 280,203	1.51%
31-Aug-2000	R 276,027	1.31%
31-Jul-2000	R 272,445	1.04%
30-Jun-2000	R 269,644	0.85%
31-May-2000	R 267,381	0.99%
30-Apr-2000	R 264,756	1.39%
31-Mar-2000	R 261,123	1.87%
29-Feb-2000	R 256,338	2.21%
31-Jan-2000	R 250,803	2.33%
31-Dec-1999	R 245,091	2.10%
30-Nov-1999	R 240,043	1.60%
31-Oct-1999	R 236,269	0.95%
30-Sep-1999	R 234,047	0.44%
31-Aug-1999	R 233,033	0.24%
31-Jul-1999	R 232,482	0.36%
30-Jun-1999	R 231,637	0.65%
31-May-1999	R 230,144	0.86%
30-Apr-1999	R 228,179	0.89%
31-Mar-1999	R 226,173	0.71%
28-Feb-1999	R 224,570	0.32%
31-Jan-1999	R 223,860	-0.21%
31-Dec-1998	R 224,328	-0.52%
30-Nov-1998	R 225,495	-0.44%
31-Oct-1998	R 226,495	-0.03%
30-Sep-1998	R 226,555	0.46%
31-Aug-1998	R 225,508	0.86%
31-Jul-1998	R 223,584	1.03%
30-Jun-1998	R 221,315	0.95%
31-May-1998	R 219,236	0.74%
30-Apr-1998	R 217,627	0.57%
31-Mar-1998	R 216,383	0.55%
28-Feb-1998	R 215,193	0.71%
31-Jan-1998	R 213,685	1.01%
31-Dec-1997	R 211,542	1.40%
30-Nov-1997	R 208,629	1.65%
31-Oct-1997	R 205,244	1.78%
30-Sep-1997	R 201,655	1.85%
31-Aug-1997	R 197,988	1.83%
31-Jul-1997	R 194,431	1.71%
30-Jun-1997	R 191,171	1.58%
31-May-1997	R 188,204	1.32%
30-Apr-1997	R 185,761	0.97%
31-Mar-1997	R 183,972	0.67%
28-Feb-1997	R 182,752	0.48%
31-Jan-1997	R 181,873	0.36%
31-Dec-1996	R 181,229	0.31%
30-Nov-1996	R 180,672	0.31%
31-Oct-1996	R 180,119	0.35%
30-Sep-1996	R 179,486	0.32%
31-Aug-1996	R 178,906	0.26%
31-Jul-1996	R 178,449	0.16%
30-Jun-1996	R 178,164	0.10%
31-May-1996	R 177,977	0.22%
30-Apr-1996	R 177,596	0.30%
31-Mar-1996	R 177,062	0.35%
29-Feb-1996	R 176,451	0.42%
31-Jan-1996	R 175,715	0.51%
31-Dec-1995	R 174,831	0.48%
30-Nov-1995	R 174,002	0.35%
31-Oct-1995	R 173,399	0.17%
30-Sep-1995	R 173,111	0.00%
31-Aug-1995	R 173,108	-0.01%
31-Jul-1995	R 173,121	0.09%
30-Jun-1995	R 172,961	0.24%
31-May-1995	R 172,546	0.40%
30-Apr-1995	R 171,852	0.62%
31-Mar-1995	R 170,794	0.79%
28-Feb-1995	R 169,460	0.79%
31-Jan-1995	R 168,132	0.75%
31-Dec-1994	R 166,889	0.64%
30-Nov-1994	R 165,835	0.54%
31-Oct-1994	R 164,945	0.48%
30-Sep-1994	R 164,158	0.55%
31-Aug-1994	R 163,261	0.71%
31-Jul-1994	R 162,109	0.96%
30-Jun-1994	R 160,564	1.18%
31-May-1994	R 158,698	1.30%
30-Apr-1994	R 156,669	1.34%
31-Mar-1994	R 154,602	1.28%
28-Feb-1994	R 152,656	1.12%
31-Jan-1994	R 150,969	0.87%
31-Dec-1993	R 149,673	0.67%
30-Nov-1993	R 148,679	0.60%
31-Oct-1993	R 147,798	0.59%
30-Sep-1993	R 146,925	0.71%
31-Aug-1993	R 145,891	0.81%
31-Jul-1993	R 144,723	0.84%
30-Jun-1993	R 143,521	0.72%
31-May-1993	R 142,502	0.45%
30-Apr-1993	R 141,864	0.19%
31-Mar-1993	R 141,598	0.07%
28-Feb-1993	R 141,502	0.19%
31-Jan-1993	R 141,236	0.50%
31-Dec-1992	R 140,528	0.86%
30-Nov-1992	R 139,323	1.05%
31-Oct-1992	R 137,869	1.03%
30-Sep-1992	R 136,469	0.69%
31-Aug-1992	R 135,540	0.12%
31-Jul-1992	R 135,377	-0.40%
30-Jun-1992	R 135,918	-0.69%
31-May-1992	R 136,863	-0.75%
30-Apr-1992	R 137,901	-0.68%
31-Mar-1992	R 138,846	-0.47%
29-Feb-1992	R 139,508	-0.18%
31-Jan-1992	R 139,758	0.14%
31-Dec-1991	R 139,566	0.48%
30-Nov-1991	R 138,898	0.77%
31-Oct-1991	R 137,841	0.98%
30-Sep-1991	R 136,504	1.13%
31-Aug-1991	R 134,974	1.26%
31-Jul-1991	R 133,298	1.31%
30-Jun-1991	R 131,578	1.33%
31-May-1991	R 129,857	1.40%
30-Apr-1991	R 128,066	1.44%
31-Mar-1991	R 126,253	1.39%
28-Feb-1991	R 124,525	1.22%
31-Jan-1991	R 123,020	1.01%
31-Dec-1990	R 121,792	0.80%
30-Nov-1990	R 120,828	0.71%
31-Oct-1990	R 119,980	0.67%
30-Sep-1990	R 119,187	0.59%
31-Aug-1990	R 118,486	0.59%
31-Jul-1990	R 117,795	0.71%
30-Jun-1990	R 116,963	0.97%
31-May-1990	R 115,835	1.30%
30-Apr-1990	R 114,352	1.58%
31-Mar-1990	R 112,575	1.71%
28-Feb-1990	R 110,678	1.68%
31-Jan-1990	R 108,850	1.50%
31-Dec-1989	R 107,246	1.12%
30-Nov-1989	R 106,054	0.77%
31-Oct-1989	R 105,246	0.61%
30-Sep-1989	R 104,608	0.69%
31-Aug-1989	R 103,890	0.93%
31-Jul-1989	R 102,933	1.23%
30-Jun-1989	R 101,687	1.49%
31-May-1989	R 100,194	1.63%
30-Apr-1989	R 98,588	1.62%
31-Mar-1989	R 97,020	1.46%
28-Feb-1989	R 95,626	1.17%
31-Jan-1989	R 94,523	0.90%
31-Dec-1988	R 93,679	0.85%
30-Nov-1988	R 92,888	0.94%
31-Oct-1988	R 92,020	1.10%
30-Sep-1988	R 91,017	1.34%
31-Aug-1988	R 89,814	1.47%
31-Jul-1988	R 88,511	1.32%
30-Jun-1988	R 87,359	1.00%
31-May-1988	R 86,495	0.68%
30-Apr-1988	R 85,909	0.56%
31-Mar-1988	R 85,435	0.67%
29-Feb-1988	R 84,863	0.97%
31-Jan-1988	R 84,045	1.31%
31-Dec-1987	R 82,958	1.53%
30-Nov-1987	R 81,705	1.62%
31-Oct-1987	R 80,406	1.55%
30-Sep-1987	R 79,182	1.35%
31-Aug-1987	R 78,129	1.20%
31-Jul-1987	R 77,205	1.16%
30-Jun-1987	R 76,322	1.21%
31-May-1987	R 75,409	1.30%
30-Apr-1987	R 74,440	1.42%
31-Mar-1987	R 73,394	1.49%
28-Feb-1987	R 72,313	1.46%
31-Jan-1987	R 71,272	1.25%
31-Dec-1986	R 70,392	0.88%
30-Nov-1986	R 69,777	0.46%
31-Oct-1986	R 69,460	0.15%
30-Sep-1986	R 69,354	-0.04%
31-Aug-1986	R 69,381	-0.18%
31-Jul-1986	R 69,505	-0.22%
30-Jun-1986	R 69,658	-0.29%
31-May-1986	R 69,858	-0.47%
30-Apr-1986	R 70,187	-0.65%
31-Mar-1986	R 70,649	-0.70%
28-Feb-1986	R 71,149	-0.58%
31-Jan-1986	R 71,566	-0.37%
31-Dec-1985	R 71,830	-0.13%
30-Nov-1985	R 71,925	0.02%
31-Oct-1985	R 71,914	-0.05%
30-Sep-1985	R 71,950	-0.23%
31-Aug-1985	R 72,119	-0.39%
31-Jul-1985	R 72,403	-0.54%
30-Jun-1985	R 72,794	-0.59%
31-May-1985	R 73,228	-0.55%
30-Apr-1985	R 73,632	-0.57%
31-Mar-1985	R 74,055	-0.71%
28-Feb-1985	R 74,584	-0.87%
31-Jan-1985	R 75,236	-0.98%
31-Dec-1984	R 75,980	-1.07%
30-Nov-1984	R 76,802	-1.10%
31-Oct-1984	R 77,654	-1.01%
30-Sep-1984	R 78,442	-0.82%
31-Aug-1984	R 79,087	-0.61%
31-Jul-1984	R 79,570	-0.41%
30-Jun-1984	R 79,901	-0.27%
31-May-1984	R 80,120	-0.18%
30-Apr-1984	R 80,267	-0.10%
31-Mar-1984	R 80,348	0.04%
29-Feb-1984	R 80,314	0.28%
31-Jan-1984	R 80,091	0.70%
31-Dec-1983	R 79,533	1.27%
30-Nov-1983	R 78,538	1.77%
31-Oct-1983	R 77,170	2.00%
30-Sep-1983	R 75,657	1.94%
31-Aug-1983	R 74,216	1.71%
31-Jul-1983	R 72,969	1.53%
30-Jun-1983	R 71,871	1.55%
31-May-1983	R 70,776	1.74%
30-Apr-1983	R 69,562	2.08%
31-Mar-1983	R 68,148	2.36%
28-Feb-1983	R 66,578	2.35%
31-Jan-1983	R 65,050	2.03%
31-Dec-1982	R 63,757	1.54%
30-Nov-1982	R 62,789	1.09%
31-Oct-1982	R 62,114	0.79%
30-Sep-1982	R 61,626	0.78%
31-Aug-1982	R 61,149	0.89%
31-Jul-1982	R 60,611	0.96%
30-Jun-1982	R 60,032	0.96%
31-May-1982	R 59,464	0.97%
30-Apr-1982	R 58,893	1.03%
31-Mar-1982	R 58,294	1.07%
28-Feb-1982	R 57,679	1.22%
31-Jan-1982	R 56,983	1.36%
31-Dec-1981	R 56,216	1.52%
30-Nov-1981	R 55,376	1.73%
31-Oct-1981	R 54,432	1.98%
30-Sep-1981	R 53,378	2.15%
31-Aug-1981	R 52,253	2.36%
31-Jul-1981	R 51,050	2.61%
30-Jun-1981	R 49,751	2.75%
31-May-1981	R 48,420	2.80%
30-Apr-1981	R 47,101	2.80%
31-Mar-1981	R 45,819	2.81%
28-Feb-1981	R 44,568	2.80%
31-Jan-1981	R 43,353	2.77%
31-Dec-1980	R 42,184	2.80%
30-Nov-1980	R 41,033	2.81%
31-Oct-1980	R 39,910	3.02%
30-Sep-1980	R 38,739	3.21%
31-Aug-1980	R 37,533	3.26%
31-Jul-1980	R 36,348	3.16%
30-Jun-1980	R 35,233	2.94%
31-May-1980	R 34,228	2.56%
30-Apr-1980	R 33,375	2.10%
31-Mar-1980	R 32,687	1.70%
29-Feb-1980	R 32,141	1.43%
31-Jan-1980	R 31,688	1.23%
31-Dec-1979	R 31,302	1.10%
30-Nov-1979	R 30,962	1.11%
31-Oct-1979	R 30,621	1.26%
30-Sep-1979	R 30,241	1.35%
31-Aug-1979	R 29,839	1.47%
31-Jul-1979	R 29,406	1.48%
30-Jun-1979	R 28,977	1.44%
31-May-1979	R 28,566	1.21%
30-Apr-1979	R 28,224	0.97%
31-Mar-1979	R 27,954	0.79%
28-Feb-1979	R 27,735	0.71%
31-Jan-1979	R 27,539	0.81%
31-Dec-1978	R 27,317	0.92%
30-Nov-1978	R 27,067	0.96%
31-Oct-1978	R 26,808	1.05%
30-Sep-1978	R 26,530	1.20%
31-Aug-1978	R 26,217	1.16%
31-Jul-1978	R 25,917	0.79%
30-Jun-1978	R 25,715	0.28%
31-May-1978	R 25,643	0.05%
30-Apr-1978	R 25,629	-0.04%
31-Mar-1978	R 25,640	-0.06%
28-Feb-1978	R 25,655	0.10%
31-Jan-1978	R 25,629	0.46%
31-Dec-1977	R 25,511	0.78%
30-Nov-1977	R 25,314	0.79%
31-Oct-1977	R 25,116	0.33%
30-Sep-1977	R 25,034	-0.21%
31-Aug-1977	R 25,087	-0.42%
31-Jul-1977	R 25,193	-0.09%
30-Jun-1977	R 25,215	0.37%
31-May-1977	R 25,123	0.60%
30-Apr-1977	R 24,974	0.56%
31-Mar-1977	R 24,834	0.54%
28-Feb-1977	R 24,701	0.36%
31-Jan-1977	R 24,612	0.08%
31-Dec-1976	R 24,591	-0.22%
30-Nov-1976	R 24,646	-0.21%
31-Oct-1976	R 24,698	-0.19%
30-Sep-1976	R 24,746	-0.14%
31-Aug-1976	R 24,781	-0.14%
31-Jul-1976	R 24,817	-0.11%
30-Jun-1976	R 24,845	0.25%
31-May-1976	R 24,782	0.69%
30-Apr-1976	R 24,612	0.90%
31-Mar-1976	R 24,393	0.80%
29-Feb-1976	R 24,200	0.68%
31-Jan-1976	R 24,037	0.58%
31-Dec-1975	R 23,899	0.63%
30-Nov-1975	R 23,749	0.72%
31-Oct-1975	R 23,580	0.84%
30-Sep-1975	R 23,383	0.85%
31-Aug-1975	R 23,186	0.47%
31-Jul-1975	R 23,077	0.02%
30-Jun-1975	R 23,072	-0.31%
31-May-1975	R 23,145	-0.16%
30-Apr-1975	R 23,181	0.57%
31-Mar-1975	R 23,048	1.43%
28-Feb-1975	R 22,724	2.04%
31-Jan-1975	R 22,270	2.19%
31-Dec-1974	R 21,792	1.83%
30-Nov-1974	R 21,401	0.79%
31-Oct-1974	R 21,234	-0.17%
30-Sep-1974	R 21,271	-0.62%
31-Aug-1974	R 21,404	-0.37%
31-Jul-1974	R 21,484	0.17%
30-Jun-1974	R 21,448	0.62%
31-May-1974	R 21,316	0.92%
30-Apr-1974	R 21,122	0.85%
31-Mar-1974	R 20,944	0.45%
28-Feb-1974	R 20,850	-0.09%
31-Jan-1974	R 20,870	-0.40%
31-Dec-1973	R 20,953	-0.24%
30-Nov-1973	R 21,005	0.54%
31-Oct-1973	R 20,892	1.54%
30-Sep-1973	R 20,574	2.19%
31-Aug-1973	R 20,132	2.41%
31-Jul-1973	R 19,658	2.11%
30-Jun-1973	R 19,251	1.58%
31-May-1973	R 18,951	0.93%
30-Apr-1973	R 18,777	0.67%
31-Mar-1973	R 18,651	0.80%
28-Feb-1973	R 18,502	1.05%
31-Jan-1973	R 18,309	1.37%
31-Dec-1972	R 18,061	1.50%
30-Nov-1972	R 17,794	1.51%
31-Oct-1972	R 17,530	1.37%
30-Sep-1972	R 17,293	1.36%
31-Aug-1972	R 17,062	1.32%
31-Jul-1972	R 16,839	1.04%
30-Jun-1972	R 16,666	0.50%
31-May-1972	R 16,584	-0.03%
30-Apr-1972	R 16,588	-0.35%
31-Mar-1972	R 16,646	-0.23%
29-Feb-1972	R 16,685	0.20%
31-Jan-1972	R 16,653	0.35%
31-Dec-1971	R 16,595	0.46%
30-Nov-1971	R 16,519	0.63%
31-Oct-1971	R 16,415	0.49%
30-Sep-1971	R 16,336	0.24%
31-Aug-1971	R 16,296	0.12%
31-Jul-1971	R 16,277	0.37%
30-Jun-1971	R 16,216	0.84%
31-May-1971	R 16,081	1.11%
30-Apr-1971	R 15,906	1.00%
31-Mar-1971	R 15,748	0.49%
28-Feb-1971	R 15,671	0.04%
31-Jan-1971	R 15,665	0.11%
31-Dec-1970	R 15,647	0.27%
30-Nov-1970	R 15,605	0.34%
31-Oct-1970	R 15,552	0.52%
30-Sep-1970	R 15,472	0.58%
31-Aug-1970	R 15,383	0.54%
31-Jul-1970	R 15,301	0.69%
30-Jun-1970	R 15,195	0.95%
31-May-1970	R 15,053	1.36%
30-Apr-1970	R 14,851	1.76%
31-Mar-1970	R 14,594	1.96%
28-Feb-1970	R 14,314	1.89%
31-Jan-1970	R 14,048	1.46%
31-Dec-1969	R 13,846	1.17%
30-Nov-1969	R 13,687	0.92%
31-Oct-1969	R 13,562	0.89%
30-Sep-1969	R 13,443	0.84%
31-Aug-1969	R 13,331	0.75%
31-Jul-1969	R 13,231	0.73%
30-Jun-1969	R 13,135	0.96%
31-May-1969	R 13,011	1.07%
30-Apr-1969	R 12,873	1.00%
31-Mar-1969	R 12,746	0.88%
28-Feb-1969	R 12,635	0.54%
31-Jan-1969	R 12,567	0.40%
31-Dec-1968	R 12,516	0.44%
30-Nov-1968	R 12,461	0.80%
31-Oct-1968	R 12,362	1.22%
30-Sep-1968	R 12,213	1.64%
31-Aug-1968	R 12,016	2.01%
31-Jul-1968	R 11,779	1.78%
30-Jun-1968	R 11,573	1.30%
31-May-1968	R 11,424	0.90%
30-Apr-1968	R 11,323	0.27%
31-Mar-1968	R 11,292	-0.31%
29-Feb-1968	R 11,328	-0.67%
31-Jan-1968	R 11,404	-0.92%
31-Dec-1967	R 11,509	-0.77%
30-Nov-1967	R 11,598	-0.41%
31-Oct-1967	R 11,647	-0.05%
30-Sep-1967	R 11,652	0.59%
31-Aug-1967	R 11,583	1.02%
31-Jul-1967	R 11,466	1.16%
30-Jun-1967	R 11,335	0.87%
31-May-1967	R 11,236	0.65%
30-Apr-1967	R 11,163	1.10%
31-Mar-1967	R 11,042	1.95%
28-Feb-1967	R 10,831	3.06%
31-Jan-1967	R 10,509	3.99%
31-Dec-1966	R 10,106	3.81%
30-Nov-1966	R 9,735	        2.70%
31-Oct-1966	R 9,480	        1.30%
30-Sep-1966	R 9,358	        -0.41%
31-Aug-1966	R 9,397	        -1.33%
31-Jul-1966	R 9,523	        -0.98%
30-Jun-1966	R 9,617	        0.00%
31-May-1966	R 9,617	        0.84%
30-Apr-1966	R 9,538	        1.24%
31-Mar-1966	R 9,421	        1.38%
28-Feb-1966	R 9,292	        1.95%
31-Jan-1966	R 9,114
Predicted property prices to 2050, using a compound annual growth rate of 10% from 2013 (please note: this is to be used as an illustration only, house prices have grown at an average annual rate of 11.12% since 1966).
Year	Nominal HP	Annual Growth
2050	R 39,686,528	10.00%
2049	R 36,078,662	10.00%
2048	R 32,798,784	10.00%
2047	R 29,817,076	10.00%
2046	R 27,106,433	10.00%
2045	R 24,642,212	10.00%
2044	R 22,402,011	10.00%
2043	R 20,365,464	10.00%
2042	R 18,514,058	10.00%
2041	R 16,830,962	10.00%
2040	R 15,300,875	10.00%
2039	R 13,909,886	10.00%
2038	R 12,645,351	10.00%
2037	R 11,495,774	10.00%
2036	R 10,450,703	10.00%
2035	R 9,500,639	10.00%
2034	R 8,636,945	10.00%
2033	R 7,851,768	10.00%
2032	R 7,137,971	10.00%
2031	R 6,489,064	10.00%
2030	R 5,899,150	10.00%
2029	R 5,362,863	10.00%
2028	R 4,875,330	10.00%
2027	R 4,432,118	10.00%
2026	R 4,029,199	10.00%
2025	R 3,662,908	10.00%
2024	R 3,329,916	10.00%
2023	R 3,027,196	10.00%
2022	R 2,751,997	10.00%
2021	R 2,501,815	10.00%
2020	R 2,274,378	10.00%
2019	R 2,067,616	10.00%
2018	R 1,879,651	10.00%
2017	R 1,708,773	10.00%
2016	R 1,553,430	10.00%
2015	R 1,412,209	10.00%
2014	R 1,283,827	10.00%
2013	R 1,167,115	10.00%
2012	R 1,061,014	0.57%
2011	R 1,054,984	1.76%
2010	R 1,036,727	7.45%
2009	R 964,840	-0.40%
2008	R 968,686	4.15%
2007	R 930,131	14.54%
2006	R 812,063	15.31%
2005	R 704,222	22.71%
2004	R 573,872	32.24%
2003	R 433,968	21.18%
2002	R 358,131	15.27%
2001	R 310,685	14.28%
2000	R 271,863	17.12%
1999	R 232,127	4.90%
1998	R 221,284	13.81%
1997	R 194,435	8.94%
1996	R 178,486	3.60%
1995	R 172,276	7.60%
1994	R 160,113	10.68%
1993	R 144,659	4.96%
1992	R 137,825	4.39%
1991	R 132,032	13.39%
1990	R 116,443	14.76%
1989	R 101,468	14.65%
1988	R 88,503	15.10%
1987	R 76,895	9.73%
1986	R 70,078	-3.97%
1985	R 72,973	-7.69%
1984	R 79,048	9.02%
1983	R 72,506	20.28%
1982	R 60,283	20.22%
1981	R 50,143	38.30%
1980	R 36,258	23.83%
1979	R 29,281	11.98%
1978	R 26,147	4.34%
1977	R 25,060	1.89%
1976	R 24,596	6.05%
1975	R 23,193	9.08%
1974	R 21,261	8.27%
1973	R 19,638	15.29%
1972	R 17,034	5.51%
1971	R 16,144	7.02%
1970	R 15,085	14.52%
1969	R 13,172	11.56%
1968	R 11,808	4.51%
1967	R 11,298	18.72%
1966	R 9,516
Notes:
House Price South Africa uses ABSA house prices for the middle segment. Prices are based on the total purchase price of all houses (including all improvements) for which loan applications were approved by ABSA Bank. Prices are smoothed for all houses between 80m² and 400m².
Houses of which the prices exceed R3 500 000 in 2011 have been excluded from the calculations, as these fall into the luxury segment. Affordable houses less than 80m² are also excluded.
House Price South Africa is independent and uses the house price trends in South Africa over the last 40 years, complemented by economic indicators and trends to forecast the outlook for the next 40 years. House Price South Africa is not associated with any estate agency or other vested interest. We welcome all contributions to the forum by interested investors.
The house price information used on this site is ABSA’s house prices for South Africa. Population figures are sourced from UN published material. Inflation figures are sourced from Stats SA website. Interest rates are sourced from SARB website.


Scary stuff. With interest rates sitting at 9% and most likely set to increase in the near future, would it be better to take a loan to buy a R2m home or save for the next 5 to 6 years and buy it cash for R2.9m? Of course, one would have to factor in the cost of renting for 6 years. Any suggestions?
LikeLike
How about buying it in 6 years time for R1.5m. In the meantime rent a similar house for a rent that is a third of the cost of paying a bond for it. The money saved can go towards your deposit in 6 years time.
In the US, Ireland, Dubai and Spain many houses have halved in price. SA is resisting the crash … yet our housing bubble was the biggest in the world … do you really think we are going to be spared the pain … it will just take longer.
In Hout Bay in Cape Town, there are 160 houses on the market in the price range higher than R6m. Only 7 in this price range have been sold this year. That is only 4% of the houses in a year … everyone thinks that if they wait long enough things will come right … maybe what is happening is that that interest rates are at a 30 year low so people are not feeling too much pain.
However, what happens when rates increase (the rand has just devalued by 25% – that alone will increase import prices by 25%) – people who are up to their ears in debt are going to start panicking. And when they see house prices are seriously falling, the penny will drop that the longer they wait, the lower the price they will eventually get … so the rush for the exits will start … and those that drop their prices first will get the sales … those left will then have to drop their prices even further.
LikeLike
I agree that property are heading for a dip, but the cost of building a house are far more than the cost of buying a house. So are property really overvalued…? I cannot see the price of building material coming down in the future?
LikeLike
I am not convinced that we will crash, but I dont pretend to be an economist. Perhaps SA property was extremely undervalued at the start? And what about the effect of overseas buyers and the fact that we have a growing black middle class with more disposable income? In Europe a large percentage of the population never buy, and our population is still growing on finite land. In my view, we will drift sideways, with property unlikely to beat inflation for some time.
Mind you, having read a lot of the comments especially from CJ, they may well be right, and the figures seem to tell a straighforward story. I just wonder if our scenario isn’t different from 1st world countries. As a guy sitting on the sidelines waiting though, I hope that the properties do adjust. In the meantime, I will carry on watching the disintegration of the euro and growing a deposit.
LikeLike
Thanks for the information presented on this blog. I took the data and decided to value to average house in commodities. It doesn’t help us if the proceeds made from the sale of a house buys less stuff, and I wanted to see how much value we can buy with the average house over time.
I think that the SA residential property market reached a high point in 2005. Now when valued in commodities, houses are worth much less in commodities. For example in 2005 the average house was worth 248 oz of gold, now its worth only 87 oz’s, same trend is apparent for maize, soybeans, oil and coffee.
I won’t be surprised if the market realizes the value destruction and starts to flee from the property market. So, yes I think we may be heading for a crash. Read the complete argument on my blog post: http://balancedlifesa.blogspot.com/2012/01/sa-property-market-your-house-buys-now.html
LikeLike
What a great article. Well done in your presentation.
Why i question your findings is that all those commodities have almost doubled in comparison to the housing price, right, well close enough. Now we all know there are many factors restricting the house price growth and one of the main one’s is Price!!! But saying that does not make sense to me… Because as you mentioned with regard to the commodities basically doubling so to must the cost of building, materials labor and so forth.
With the price of all most everything going up and up and up, does it not make sense the property values must trend the same way?
So to me as a property investor for some time now i find that getting rentals at around the 7.5% initial annual return is not that bad because my annual return on the investment is already around 6%. The key here is to buy wisely (cheap!!!) I am saying this because i have a good idea of the replacement cost of the house i am buying and adjust my offer to purchase accordingly.
My reasoning for all this is that as you pointed out prices have mostly doubled in all classes so to me with time so will property. I am a long term investor, i don’t think my theory will work as a short term option
Anyway my 2 cents worth!!!!
LikeLike
Hi,small business person still never get the house in capetown
LikeLike
We are on the verge of a major house price crash, the insane prices are simply unsustainable, it will need to come back to the fundamentals i.e. the indisputable link between income growth and property values. In CT I have been watching about 2-300 properties over four months. Hardly anything has moved, a few have been seriously reduced and yet not snapped up. Reasons, over in depted consumers and lack of mortgage finance. However, the one single factor which will move prices in CT are the internationals who have flooded the CT housing market during the past decade. The European financial crisis seem to have begun the stampede to get out of the market, there are more properties for sale in Constantia, a favourite neighbourhood for international purchases, than anywhere else. Prices are being reduced by 100 000’s daily as owners jostle to find a brave buyer. The panic will increase over the next few months, prices will continue to fall and eventually begin to affect neighbouring suburbs, which is already happening. I cannot say that I have any empathy with these owners, for property prices to be reduced to affordable levels is a very good thing for the local population, who have good income levels but have been priced out of the market.
LikeLike
i fully agree with you. Property prices in kenilworth are insane, i just viewed a flat that is 53sq/m..1 bedroom 1 bathroom with open plan lounge and kitchen.Owners are sellling at R895K…I mean really…i could buy a house for that price in Goodwood.
LikeLike
One must keep an eye on the US property market which our market seems to mirror. House prices there were set to decline accross two thirds of the states but have recently shown some signs of a recovery. Perhaps this could bode well for a gradual recovery of our own market?
LikeLike
Hi Steve, do you know of any graphs showing that our house market tracks the US market? I have read this, but can not recall seeing anyone prove this theory.
LikeLike
I have been watching prices in WC really closely over the last 12 months. i have a property in the UK and have watched it lose 20-25% in value over the last 3 years, but fortunately rents have increased and interests rates have come down by 50 -75% so i have been lucky enough to take advantage and pay off my mortgage..I have also noticed sterling strengthen significantly against the rand.
The problem with SA is the economic and political climate scares investors, people with cash are waiting for the crash to happen, a blind man can see this coming, with high interest rates compared to UK,Europe the US etc and really high levels or personal debt and low wages make this a recipe for disaster. Prices could very easily halve, if not more to be totally frank, that is what shrewd overseas investors especially are waiting for and South Africans just can’t afford to buy.
I am in a position to buy myself but there is no way i’m going to until i think i’m getting a bargain, which in my opinion is about 50% lower than the valuations now.
LikeLike
We need more people thinking like this! 🙂
LikeLike
Hi I am doing an assignement on nominal and real house prices. I have three questions in particular that I am really having a hard time with as property isnt reall y my game at all, I was wondering if one you property gurus could please help me? Here are the questions:
1. Do house prices in SA give a true reflection of the price level of inflation? (2)
2. What is the role of money supply and credit access in the above scenario? Find data to support this. (5)
3. Explain the difference between the growth rates in real & nominal house prices to your client. (3)
LikeLike
Is the (2) , (5) & (3) the mark that you get :).. Pls read the bolg all your questions will be answered
LikeLike
Google number 3 for heavens sake
LikeLike
hi, did you get answers to these questions.
LikeLike
Broadly property prices will keep up with inflation. If the Rand weakens, then property prices will rise accordingly, as will rents etc. This will not happen immediately, there will be a lag effect – but overall the prices will rise to reflect value of money. A number of factors fueled the most recent property price growth over the last decade including benign interest rates, easy access to credit, historically undervalued house prices, economic prosperity, emerging middle class, double income households.
LikeLike
Property prices (like all other commodities) will fluctuate over time. My view is that property is still one of the best investments of all time, provided you buy for the long term. For an investor the 1st 7 years are usually challenging (with low returns & often negative cash flows). However once rental increases rise above the costs (bond repayment, rates, levies etc), you see positive cash flows, and that is when it becomes really appealing.
Property is also one of the few asset classes that lend itself to gearing. Unlike other investment types (equities, cash etc), you can purchase a property valued at R1M by putting up only R100k (10%), yet still enjoy the capital growth on the full asset value.
LikeLike
I strongly disagree. Residential property seldom actualises more than 10% growth pa, and usually averages less than 4% return on your investment once you take all costs (finance and maintenance, etc) into account, even against rental income!
Seriously, for those people that like to invest in property, it is much cheaper and a lot easier to buy into a SA property fund that primarily invests in exchange traded property companies. At the moment most of these are well over 30% and several up to 37%. And when you see a crash – it takes 1 day to sell your holding.
If you are looking for return on Investment, do not buy residential property, invest into financial funds, where even moderate investments should give you an average return of over 12% after costs (usually more than double the return on residential property).
Another current problem right now – go and ask the estate executors how well they are doing trying to sell the portfolio of properties their late client’s have left behind. Why pass this kind of problem on to your family?
LikeLike
There are a lot of people who still believe that property represents an investment and this will be realised over time. Everyone tells you ” hang in there, you will see the results in 10 to 15 years”
Bollie! My own scenario: My house was bought in 1996 at R 220k. Property in this area at that stage was selling at between R280k and R 350 k , so this was a good buy !
The value put on it by the municipality as in 2012 was R 1,15m. According to estate agents I should get in the order of R1.5 m. Halleluja. This proof the so called experts right. Within 15/16 years the value has rissen more than 5 times according to the municipality and almost 7 times if you believe the estate agents.
Here’s the snag- Sell it for say R1.3 (in the middle). Yoy can even sell it for R 1.5m.Take the money and go buy yourself another house of the same size and with the same ameneties. You WILL NOT get it ! You will have to scale down on your requirements. Whatever explanation you want to give for this, you can not argue that you have realised any growth. Investing in something means you will get more for your money after a given period and not less in real terms.
Propery is not an investment at all in monetary terms.
LikeLike
If you did not have the house you would have paid rent for 14 years? If you were renting it out there would have been income that could be reinvested…
LikeLike
Let’s not wander on hypothetical venues of ” if….could…. would…” I bought the house. I did not rent it out. I did not pay rent. There was no additional income to re-invest. It is a so called investment in itself.
My house is fully paid.I want to sell and utilize all the money I get to buy a better place based on the gains I have from my “investment”. I can’t do without scaling down or paying additional money.
Proof me wrong in the real world!
LikeLike
In the book Rich Dad Poor Dad the author claims a property that you live in to never be called an investment but rather a liability, and it really irks him when people refer to it as their “greatest investment”. You have your bond interest and many other costs associated, and unless you eventually scale down, you will never see the fruits of the “investment” because you need to live somewhere. If you sell you can only buy the same quality at the same price, so there is no gain unless you go homeless or downscale. I believe you are right Piet. Property purchased for both above inflation capital gain and rental income is an investment. Many people believe that they are better off renting their primary residence, and investing the surplus elsewhere. They claim to have done the maths, and over the long run you are better off. I have not had the resolve to do the maths myself so cannot comment.
LikeLike
I think its simply this – your primary house and car are not investments as you need them to live in and drive. However – it is creating investment money for you. You only paid off a R220K bond – now you would be paying off a million. If bond free – you are living rent free.
For example if I bought in my neighborhood in 2004 I would have paid about R450K for a decent house. Now that same house would be R1.5 million. R4K a month versus R13.5K a month with 10% deposit. Even inflation adjusted its a no brainer. I am now renting for less than half the price of buying – R8K a month (taking into account rates and utilities), but that is still a whack of money – where guys like you got into the property market at the right time and are saving on massive rentals and bonds. So you are benefitting big time even though the house is as you say not an investment. Thats the way I see it.
LikeLike
Hi Piet
Correct me if I’m wrong, but your logic seems flawed. You’re saying that you wont be able to buy a like for like house? Why not? The only reason I can see is;
1) the expenses you’d have to pay in selling and buying a house. Yes, it can be a lot, but compared to the overall cost 5-10% isnt that bad.
2) You’re not comparing like for like. If your house is worth R1.5 mill, there is no reason why you cant get a similar house in a similar area (area has a lot to do with house prices) for a similar price.
You’re also saying that the house is not an investment. Why not? if you had invested R220 000 and it grew by +6 times to R1.5mill, Is that not an investment? How much of your own money did you use to make that R1.5mill? R2400 a month for 20 years? that only equates to R576 000. So that almost R1mill you made. Congrats. Sounds like an investment to me.
Now try the maths yourself. if you invest R2400 a month for 20 years. how much would you get? now for extra credits. Try including in paying rent for the duration of 20 years. For even more credits, try including house maintenance.
I’ve done the maths. Unless your maintenance expense is extorbitant, you’re better off having bought the house….
LikeLike
My advice would be to keep the house you have. No point in moving to “something similar”. Its paid off and now the costs are low.
In a few years, the kids will leave, and you can think about downsizing!
Any extra cash you have now is better invested elsewhere for your retirement.
LikeLike
Oops, should have used 15/16 years instead of 20. oh well. same same
LikeLike
James. You echo my problem in a way I could not put it better.
A similar house in a similar area at a similar price? So, where is the growth or gain or capital appreciation gone to? I’ve gained a million rand but I have to be content with something similar? Wow!
At the same time, if I have to pay in 5-10% percent I should not feel too bad ! Again Wow ! After I’ve had an investment gain of a million rand I may have to fork out (on top of my investment plus my gains) another 75 to 150 000 rand to have a similar house in a similar area. So, not withstanding my huge gain I am set back by 75 to 150 grand. Sounds ridiculous to me.
I want to use my investment gain to buy better! Not similar! If I have to buy similar where is the return on my “investment” ?
Following the same logic as you by theoretically comparing different asset classes I should have invested in a couple of Pierneefs or Sterns in order to “proof” the gain over property!
Proof me wrong in the real world. Not in theory by calculations based on different asset classes!
Only thing you do is to maintain the equilibrium. It is not a good investment unless you revert to theory!
LikeLike
Stop wying and sell the house now before the price drops more. (and it is going to drop more)
LikeLike
*whining. 🙂
LikeLike
Advises the wannabe property expert with the clearvoyant abilities of Siener van Rensburg.
LikeLike
It’s all relative Piet. If you’re looking at the same asset class. Your “investment” has to grow at a better rate than others to improve your standing.
LikeLike
The only ROI is when you have paid your house off, and the cash you would be shoving as interest on bond repayments to the bank can be used for alternate investments. 100% on the money Piet.
LikeLike
Please help the laymen. Can you please define the terms Nominale and Real price.
LikeLike
Hi Japie, “Nominal” is the actual price that you pay for the property at the time. This is the price that when you look back 20 years ago, it seems like house prices were cheap back then. “Real” price takes into account inflation, so that actually the house 20 years ago was still expensive v what people were being paid then. Therefore in real terms house prices 20 years ago were not that cheap! Does that make sense?
LikeLike
Piet’s argument is the stupidest I have ever seen. Paying more for a similar house in a similar area? Then you are selling below the market value! That is stupid. OR you are paying too much when you buy. A similar house in a similar area should be at a similar price. When you sell your house you are selling it to someone who buys it and when you buy a house you are buying it from someone who sells! Get it? Hey?
And you cry about “experts with clairvoyant abilities”. You are suffering from a similar neurosis Siener van Rensburg suffered from.
LikeLike
Do you understand the costs involved with buying and selling property? There are estate agent fees, legal costs, and transfer duty to the Man.
LikeLike
I’ve read all the posts and have to agree with the author of the book Ron referes to. The only investment from your 1st property is that it frees up future income. If interest rates remain constant, so does your bond repayment.
LikeLike
Piet once your house is paid off you are living in it rent free (plus you have not paid rent for these years). Is that not an investment in itself? As for upgrading once you sell that 1.5 becomes your deposit and you put in extra $$ for the upgrade. But doubtful you will get an upgrade by selling your current house and not putting in extra cash – like for like….
LikeLike
Please take into account that this House Price South Africa crowd works on averages and there is no such animal as an “average” property. For the property investor this actually means diddely squad. Its stuff for economists and other salaried experts. If you buy a house you buy a specific property in a specific area and a specific street. The ONLY real consideration is info like available from Lightstone.
LikeLike
Your input on specific property prices is correct Adriaan. What HPSA is looking at is the more strategic big picture. A general upswing will lift all properties, a general downswing will suppress all properties. As you point out, individual properties within that will show variances specific to their circumstances.
LikeLike
Interesting read guys – however, someone explain to me how they can say house prices are too high? It costs in the region of R6k/meter square to build an average finish home. Say 300m 2. Thats 1.8m to build the house. Not allowing for cost of the ground, landscaping, etc.
However, the “market” says that the value of this property (if you want to sell) is R1.1m!!!
And that is taking area into consideration. Featherbrook estatse is another example – Probably 8-9k/m2 to build. You can’t get more than 70% of that on resale.
Really?
LikeLike
hi…i want to conduct a thesis on real house price growth in Pakistan of 1 2 3 4 classes of comfort, but i couldn’t found the data yet, would you please help me, or suggest any web site from where i can get the data as early as possible…
LikeLike
Hi, sorry I do not know this information.
Good luck.
Regards,
LikeLike
I’m following the discussions for some time now. Thanks to HPSA for an informative site and a platform to debate this relevant topic. Being a property investor myself, I must confess I’m somewhat out of my depth when looking at my own situation. The facts are clear-house prices have grown at an average annual rate of 11.12% since 1966 and a prediction of 10% over time make sense to me. One (of many examples): I bought a unit in a sectional title complex for R350 000 in 2006. This was a reasonable price. At a10% growth rate, the value should have been R728 000 by now (2014). In the mean time we had a crash and an oversupply. Everything being said, the units still sell for R350 000 – R400 000. This is a discount of 55% in a well-managed complex.
Property analysts predict the next peak in the market to be in 2018. Does this mean the prices will ‘jump’ to catch up with the backlog? At a growth rate of 10% the price will have to be north of R1 million.
LikeLike
Do you think there is a backlog in growth? We had the greatest boom in the world in house prices, 421% over 13 years. Developed countries with similar booms got knocked back 30-40%, and have since recovered most of their prices since 2008. Their markets are now apparently under pressure.
We have not dropped like they have. Borrowing money hasn’t been this cheap in decades yet consumers are still highly indebted. We are in an interest rate increase cycle and the economy is contracting. Strikes are hurting us badly.
We may be unique in regard to apartheid demographics and middle class growth, but in my honest opinion, dont look for much real growth above inflation anytime soon. But as other guys on here have said – nationwide figures are irrelevant to individual properties which if in good areas can still perform, so hopefully yours will as well.
LikeLike
Forget house prices – ask only is this a buyers market or a sellers market. I have lived in South Africa where there are for sale signs everywhere and sellers are falling over themselves if you show an interest in their property. By contrast, the last decade people were falling over themselves to buy property. At the moment in 2014 there are very few for sale signs anywhere but interest rates may have started their long term up cycle after a 30 year decline. Give it some time if interest rates rise quickly you will find good deals as the for sale signs start to pop up.
LikeLike
I am not involved in buying or selling, but have a lot of fun just watching prices from the sidelines. Several of my friends are in the process of selling their house/s for one reason or another. All are being advised by their respective REALTY AGENTS on what they should expect for their houses. Not one of the sellers are getting the sales, even after dropping the prices to below ‘market value’.
(agents quote). This, and the statement earlier about property ADVERTORIALS, leads me to believe that agents are pushing their own agenda hoping to drive the property market up to unrealistic expectations. Most potential home-owners seem to be rather looking at the rental market at present, and even in this, they appear to be very selective. It is as if they seem to be adopting a “wait and see” attitude, not only because of the inflated prices, but also due to the present looming financial and political changes that is awaiting us down the road.
This is a great blog, and I am sure that your following is going to improve as more people are becoming more savvy as to what is happening around them, not just in S.A., but wo.rld-wide
LikeLike
In my experience most Estate Agents are interested in their own agenda and will come up with any story to suit the situation. Beware
LikeLike
New houses cost 50% more than old houses BECAUSE OF INFLATION. Developers will only start building again when old houses become 50% more expensive. There is still an over supply of houses build before the recession that is still a bargain. House prices double every 10 years and it will never stop because of inflation. It is still the best save investment.
LikeLike
Gert, Where do you live. For the past 5 years house prices in our region did not even gain 5% in value!!
LikeLike
I am very surprised at how some people reason.
1. If you bought 10kg of gold 20 year ago and sell it today, don’t expect to take your money and go buy more that 10kg of gold. You will probably buy less than 10kg because of evaluations and handling fees.
does that mean gold is not an investment, well maybe one needs to revisit what your interpretation of “investment” is.
It is almost like saying you invested R500 000 a couple of years ago and today you have R1,5m…… but you are upset because when you go to the shop you can only spend R1,5m and nothing more. (so you believe there was no growth)
2. Someone said earlier each transaction is unique. That is so true. I have recently bought a house for R1.3m. My Instalment is R13500 per month. Well I had to relocate due to work and if I didn’t buy the property, I would have paid R9000 rent per month for the same size house in the same area. It would be completely ridiculous for me not to buy. Yes there is definitely a risk involved in terms of interest rates. One need to make sure that you will be prepared for a increase of interest rates.
Lets say 20 years from now, interest rates did not increase and my house prize did not increase and there was no inflation. Then I could have the following outcome:
Rent: 240 months X R9000 = R2 160 000
(loss – have nothing to show for it as the house is not mine)
Buy: 240 months X R13 500 = R 3 240 000
(a loss of R 1 890 000 BUT a house worth R 1 350 000)
With Renting I would have nothing to show and have spend R 2 160 000 on rent
With BUYING would have lost R 1 890 000 on interest but still have a house valued at R1 350 000
Then saying that you will loose a lot of money to buy, is absolutely TRUE, but you will loose more to keep on RENTING.
LikeLike
VERY NAIVE ANALYSIS….IF YOU PUT THE 4500 PR MONTH YOU SAVE RENTING INTO UNIT TRUSTS , AFTER 12 YRS WITH COMPOUNDED INTEREST YOU WOULD BE WINNING BY FAR! YOUR ARGUMENT IS REALLY CRAP!!!
LikeLike
your clearly did not understand the calculation. One thing that I made clear about the calculation was “Lets say 20 years from now, interest rates did not increase and my house prize did not increase and there was no inflation. Then I could have the following outcome:” Thus to try and make a comparison with Unit Trusts is quite Naive
LikeLike
When the average gross salary for a man in RSA is around R220,000 per annum or around R16,000 per month after tax, you don’t need to be genius to understand that first-time buyers are simply priced out of the market. Even assuming a net family monthly income of R25,000, the most the banks would realistically lend you is R900,000. Good luck finding a decent house for that price! And many many South Africans are living on far less than this, Unless you bought pre-2002, you are essentially screwed. All of this points to a massive house price crash, as the current levels are simply utopian and most definitely unsustainable, When nobody can afford anything, the whole market comes to standstill.
LikeLike
You would think so – I went overseas for 8 years and came back to madness. The only people I know who have bought since brought back pounds/dollars. I am earning decent money – but a decent house in Westville Durban would cost me about 1.5 – 2 mil – about R20K including rates and utilities and 10% deposit. I pay less than half that renting with no maintenance and rates. And the underlying asset over the last 5 years has barely matched inflation. So I’m sitting on the fence, although I would like to buy. But whether it will crash, I dont know. It seems it has to considering the current economic climate, affordability and interest rate hikes, but who knows? Those markets who boomed like ours like Ireland and the US already had their crash years ago. Good suburbs are limited and numbers increase. The North Coast of Durban continues to boom – especially Umhlanga. Maybe we are unique (apartheid and emerging middle class) and were very underpriced?
LikeLike
I have been putting in a few offers on some coastal property recently (not unreasonable) and I just get laughed at so it has to be said that no one is interested in considering at lower prices even though according to agents there is a huge amounts of supply stock. My impression is that there is no selling pressure in the SA market at the moment – just specualtive sellers hoping to make a killing. But the tide could turn at any time – I would like to see a cap on foreign ownership of SA residential market. With the Rand so weak at the moment and without any sign of interest rates rising (yet) property in SA is like Chump change to a foreign buyer from Europe who can get a personal loan for just 3.8% from some banks at the moment.
LikeLike